 Mail :
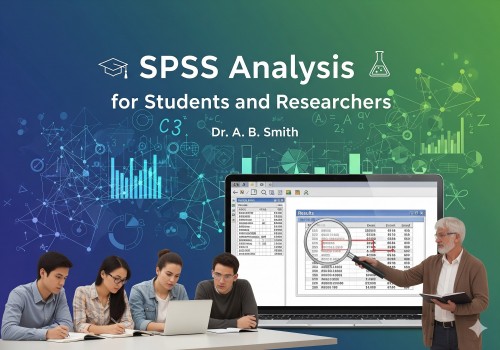
Data analysis is an important component of academic research and business intelligence and social science. SPSS (Statistical Package for the Social Sciences) is one of the most popular sources of statistical work. By knowing the process of SPSS analysis, students, researchers, and professionals would be able to transform raw numbers into valuable information. Be it the survey data or the experimental findings or the company reports, it is SPSS that has simplified all complicated statistical calculations and in a lucid form.
Introduction to SPSS
SPSS has been designed such that data can easily be handled. It lets users enter data in tabular format and subsequently analyze a wide range of statistic tests. When inquiring people, the question has been how SPSS analysis will benefit my research, the solution is that it can deal with different magnitudes of data and end up with fewer errors, it is simple to understand the results in terms of tables, charts, and graphs.
Steps Involved in SPSS Analysis
To know more about how SPSS analysis work, we should deconstruct the process:
- Data Entry – The information is either manually keyed in SPSS or imported into the software through programs such as excel or the CSV file.
- Variables Definitions – The heading of a column is called variable and researchers should indicate whether it is nominal, ordinal and scale.
- Choosing Statistical tests- SPSS has t-tests, regression, chi-square, or correlation tools depending on what research needs to be accomplished.
- Analysis Operation -In a matter of a couple of clicks SPSS can run calculations that would otherwise take hours to complete with a manual calculator.
- Results Interpretation -The output in SPSS comes in interpretable tables and graphs, hence results are easy to come up with.
Why Researchers Prefer SPSS
The flexibility of SPSS is the reason why many scholars as well as professionals base their works on it. They will no longer have to be concerned with the manually calculated formulas but only the meaning of the results. To those of you thinking, How SPSS analysis help in data analysis? The most important benefits are:
- Fast and precise statistical calculation.
- Easy-to-use interface as opposed to more-coded tools.
- Capacity to work with small and large (and indeed very large) datasets.
- Readably and visually presented results.
Applications of SPSS in Different Fields
The importance of how SPSS analysis works is very broad as it can be seen when its applications in numerous industries:
- Academia: Assists students to interpret survey feedback/experimental research.
- Healthcare: Helps to analyse patient outcomes or clinical trial results.
- Business: Aid to include market research, staff survey, financial analysis etc.
- Government: It gives data to the policy formulation based on population figures.
As SPSS has been able to accommodate various fields it has become the universal quantitative analysis tool.
Common Challenges that how SPSS analysis is conducted
Although using SPSS is not very tricky, there are certain issues they may encounter. Novices tend to find it hard to choose the correct statistical test to use or figure out the results presented. That is why tutorials and professional advice are needed in the learning of how one should apply SPSS analysis effectively. With time, practice can provide confidence and precision to researchers.
Also Read: Great Benefits of Data Analysis |Data Analysis Using SPSS Testing in Dubai
FAQs on How SPSS Analysis Works
1.Do I require any form of knowledge in Statistics going into SPSS?
It is good to have specific knowledge, yet SPSS is provided also to nov users. It can offer guided menus that make analysis easier.
2.Does SPSS take care of non-numerical data?
Yes, SPSS is able to analyze categorical variables, i.e., gender, region, or preferences, but they can be coded into the numerical field.
3.Does SPSS have any academic purpose?
No. Although commonly used in students and research related works, it has also been used by businesses and government organizations to make decisions using SPSS.
4.What is the difference between SPSS and Excel in terms of the analysis of data?
Excel can be used when some simple calculation is needed, but what makes SPSS analysis special is the capacity to conduct sophisticated statistical tests and work with complicated data.
Final Thoughts
Learning how the SPSS analysis can work places the power to convert raw numbers into useful information in your hands. SPSS helps present the data in a professional and accurate way as well as in an actionable way to students who are writing dissertations, companies where researching customer behavior or any other company that is doing research of some kind.